Transform your data into powerful insights with my Power BI services. I design interactive dashboards, create custom reports, and provide data analysis solutions to help you make informed decisions and drive business growth. Unlock the full potential of your data today!
1. Insurance Policy & Risk Analysis Dashboard
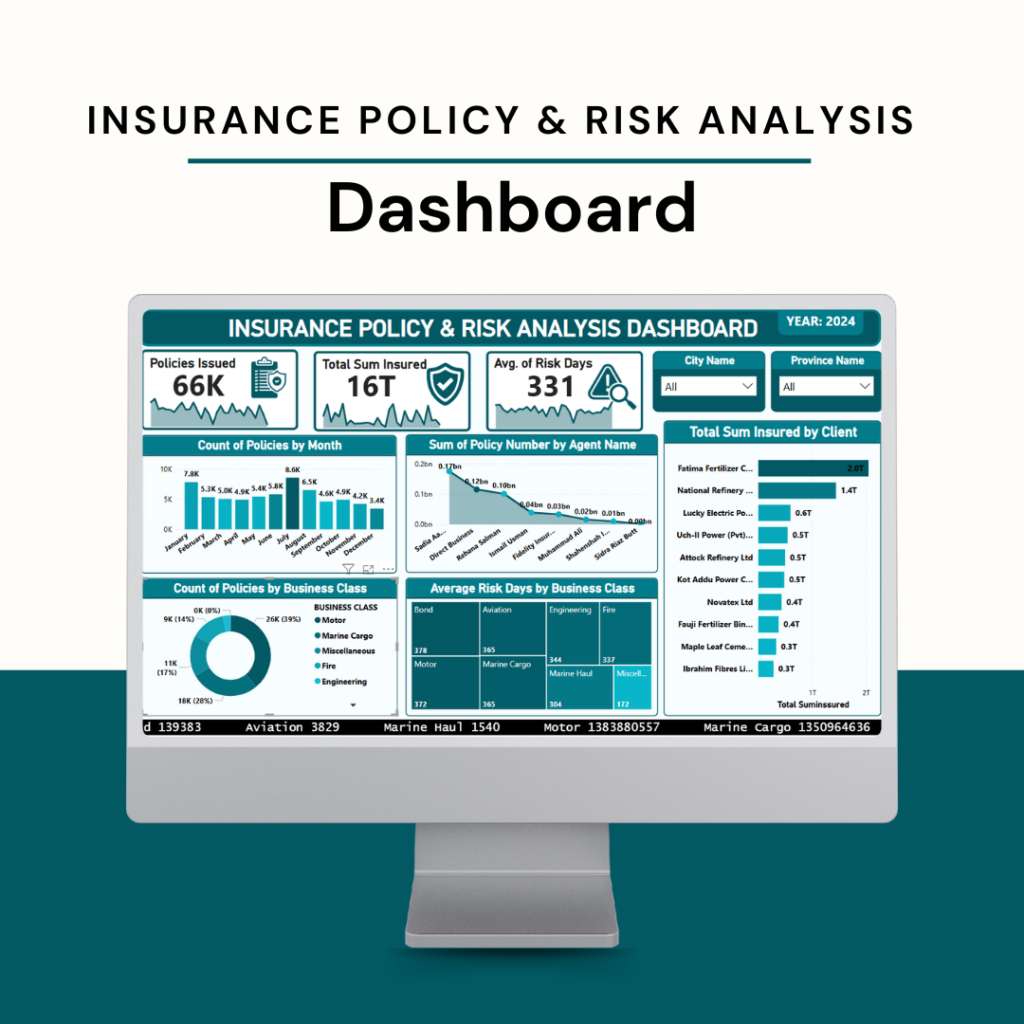
This dashboard provides a comprehensive overview of policy performance and risk assessment. It helps insurance professionals make data-driven decisions by visualizing key metrics.
This Power BI dashboard provides a comprehensive overview of :
Top Highlights: Total policies issued, Total sum insured, Avg. of risk days.
Dynamic Filters – Easily refine data by city name and province name.
Policies Trend Analysis – View the count of policies by month to understand market trends.
Agent Performance Tracking – Analyze the sum of policy numbers by agent name to evaluate sales effectiveness.
Risk Assessment – Monitor the average risk days by business class to detect potential risk patterns.
Interactive Visualizations – Graphs and charts provide a clear view of policy distribution, agent contributions, and risk factors.
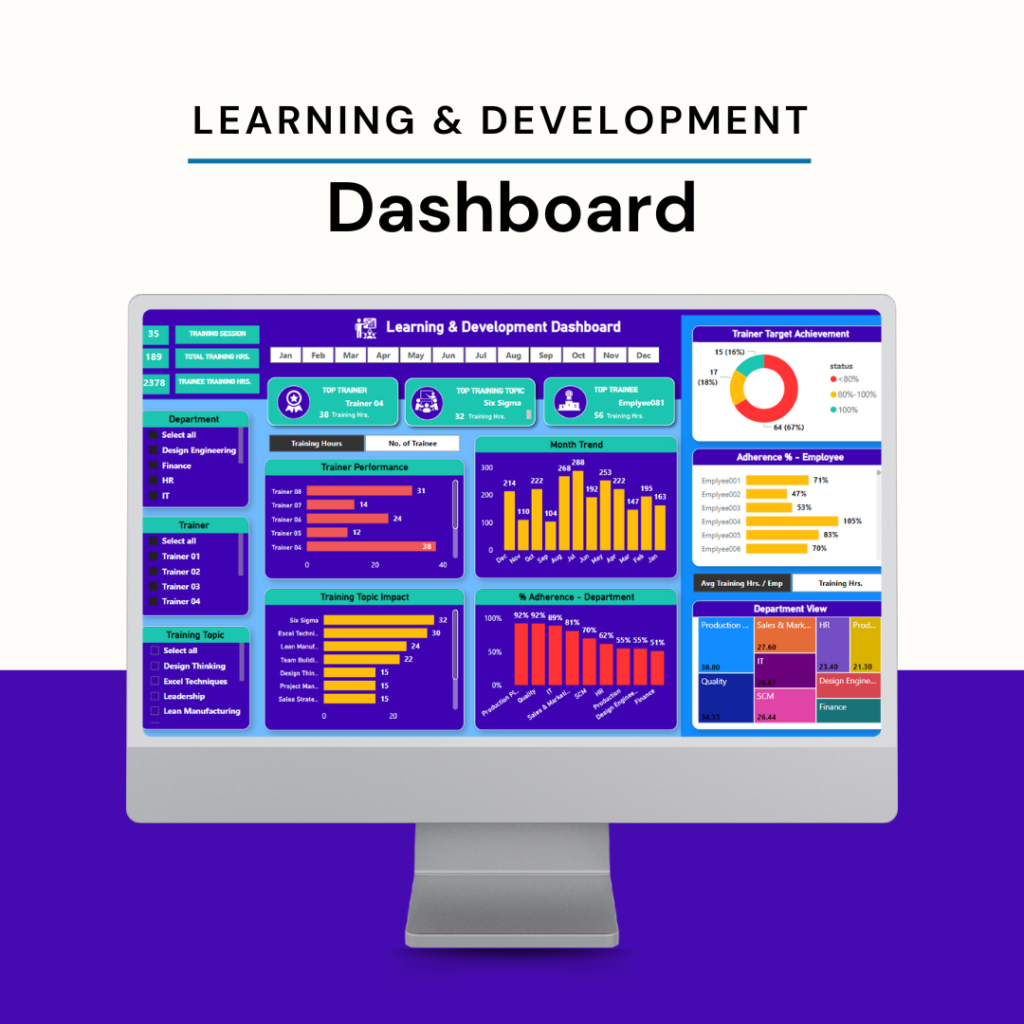
This interactive dashboard provides a comprehensive overview of Employees Learning and Development. It is designed to simplify complex data, helping businesses maximize profits and optimize strategies.
This Power BI dashboard provides a comprehensive overview of employees:
Top Highlights: The top trainer, top training topic, and top trainee
Training Metrics: Visualize total training sessions, overall training hours, and individual trainee hours.
Customizable Views: Filter by department, specific trainer, or training topic for detailed insights.
User-Friendly: Real-time data to track performance and enhance decision-making in learning initiatives.
Visual Charts: To analyze trainer performance, month trend, training topic impact and other important asspects
Data Overview: to enhance employee learning experiences and support their professional growth!
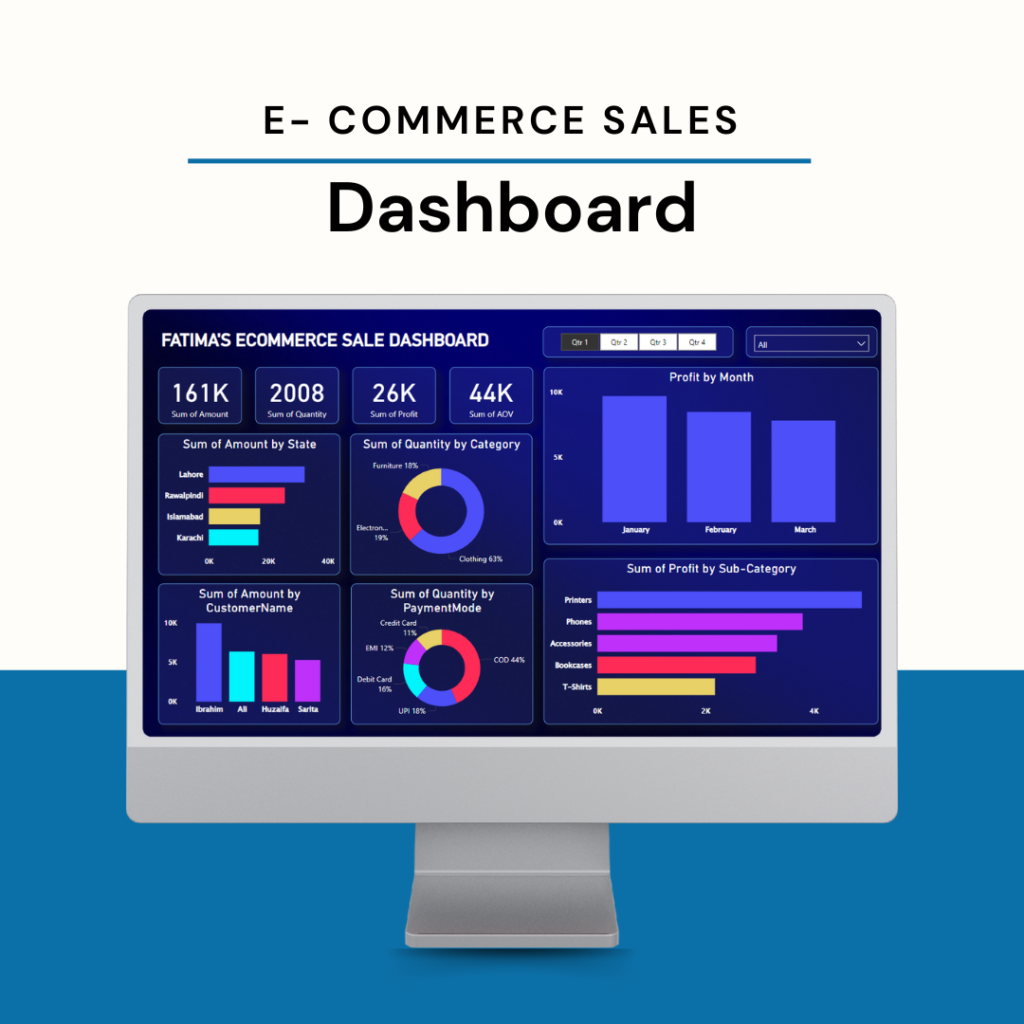
This interactive dashboard provides a comprehensive overview of E-Commerce Sales. It is designed to simplify complex data, helping businesses maximize profits and optimize strategies.
This dashboard highlights performance, enabling data-driven decision-making. Key features include:
Quarterly Filters: Easily analyze data by specific quarters to track performance trends over time.
Sales Metrics: View key metrics such as sum of amount, sum of quantity, sum of profit, and average order value (AOV) at a glance.
Visual Insights:
Profit by Month: Understand profitability trends with detailed monthly graphs.
Sales by State: Discover top-performing regions with state-wise sales visualizations.
4. Customizable Views: Filter and drill down into data to uncover insights tailored to your business needs.
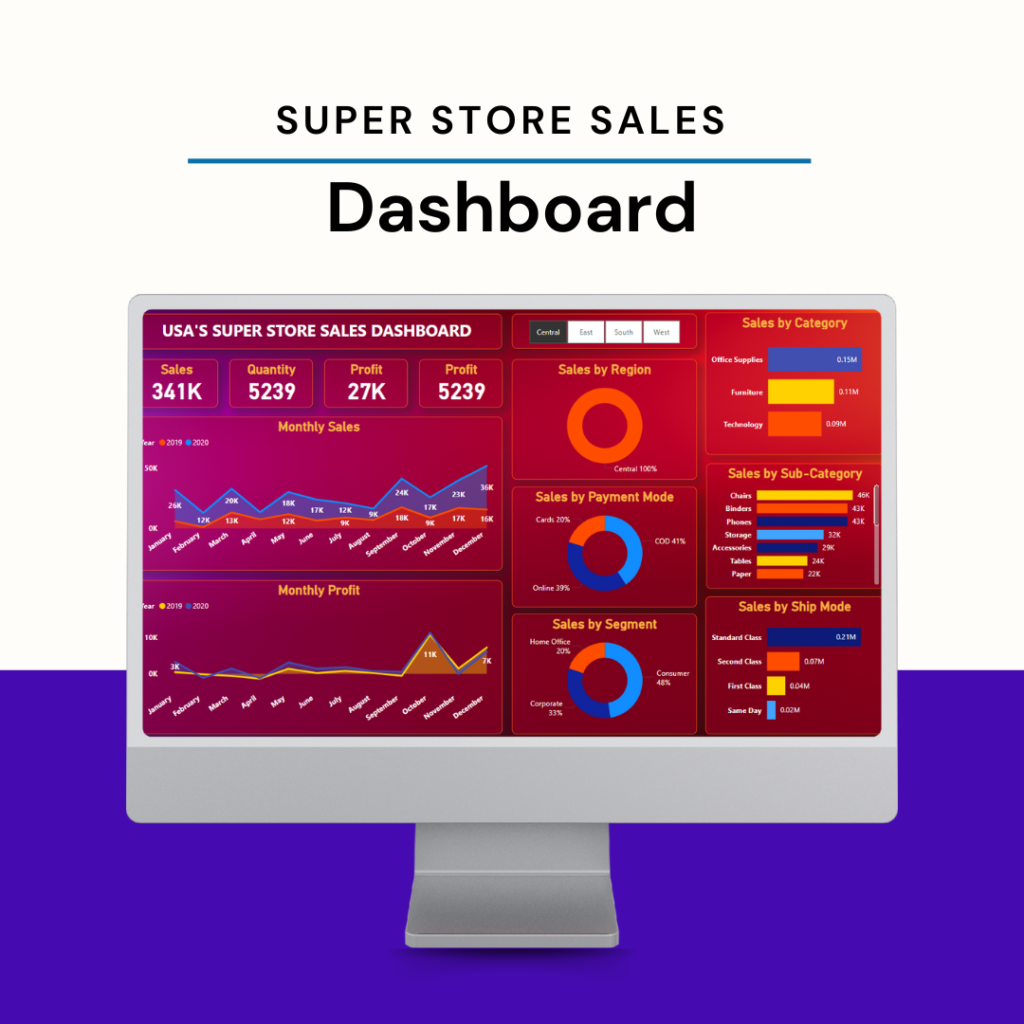
This interactive dashboard provides a comprehensive overview of Superstore Sales. It is designed to simplify complex data, helping businesses maximize profits and optimize strategies.
This interactive dashboard provides a comprehensive overview of the Superstore’s sales performance.
Sales Analysis: Tracks daily, weekly, and monthly sales trends.
Regional Performance: Analyzes sales performance across four regions: East, West, South, and North.
Product Analysis: Explores sales trends by category (e.g., Office Supplies, Furniture, Technology). Delves deeper into sales performance by sub-category (e.g., Binders, Chairs, Phones).
Customer Analysis: Examines sales patterns based on customer segmentation.
Order Analysis: Analyzes sales trends by ship mode (e.g., Standard Class, Second Class) and payment mode.
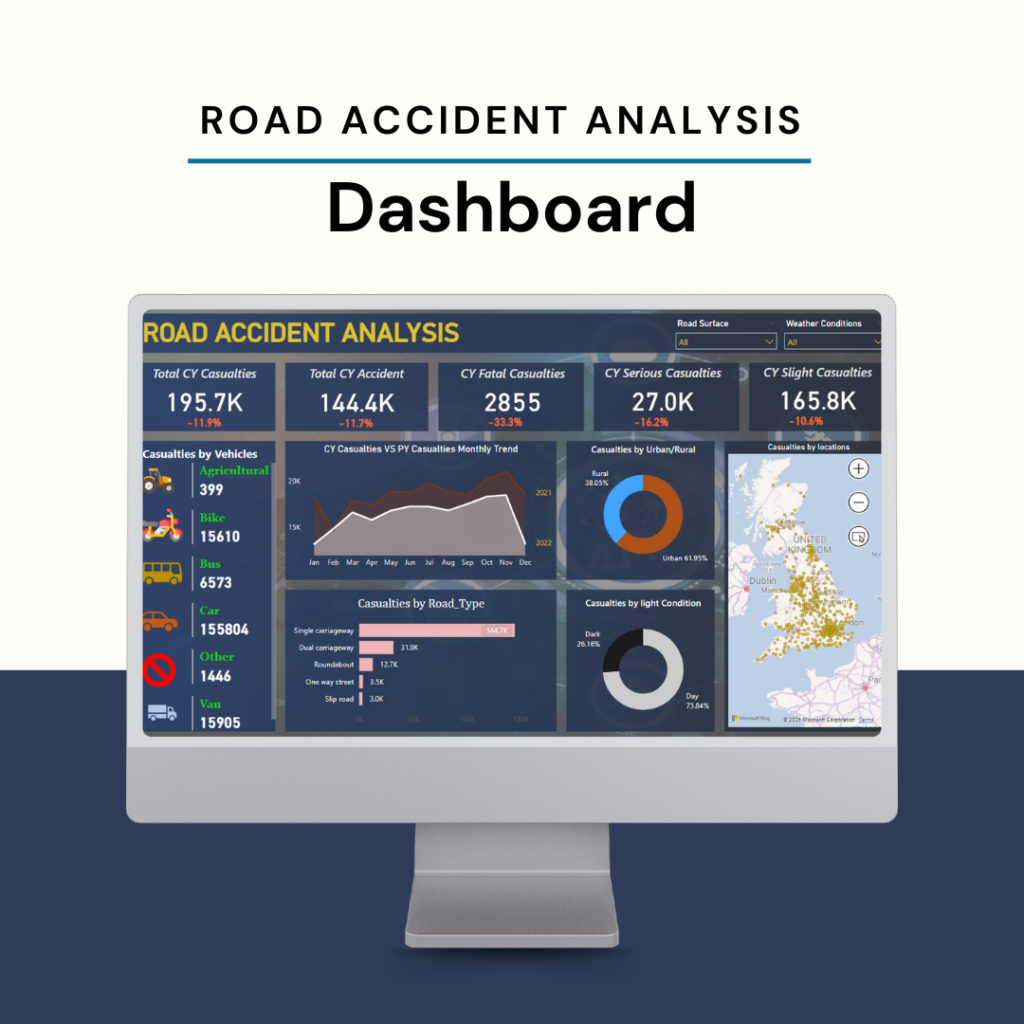
This interactive dashboard provides a comprehensive overview of Road Accidents. It is designed to simplify complex data, helping businesses maximize profits and optimize strategies.
This interactive dashboard provides a detailed analysis of road accidents, focusing on key factors contributing to fatalities.
Casualty Analysis: Displays current year casualties, providing an up-to-date overview of the severity of the road safety issue.
Geographic Analysis: Maps the locations of accidents on an interactive map.
Vehicle Type Analysis: Examines the involvement of different vehicle types (e.g., cars, motorcycles, trucks) in accidents.
Environmental Factor Analysis: Includes filters for “Road Surface” and “Weather Condition,” enabling the analysis of how these environmental factors influence accident severity and casualty rates.
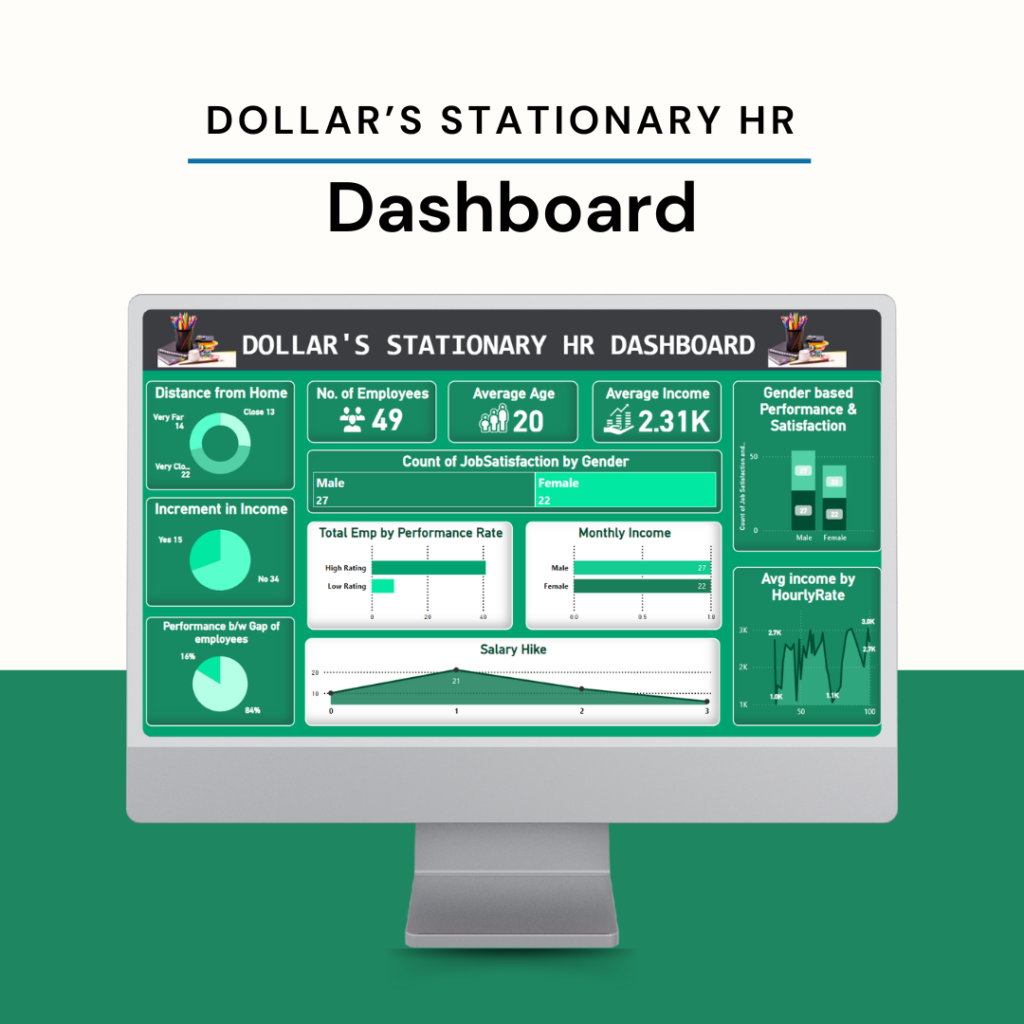
This interactive dashboard provides a comprehensive overview of Dollar’s Stationary HR Dasboard. It is designed to simplify complex data, helping businesses maximize profits and optimize strategies.
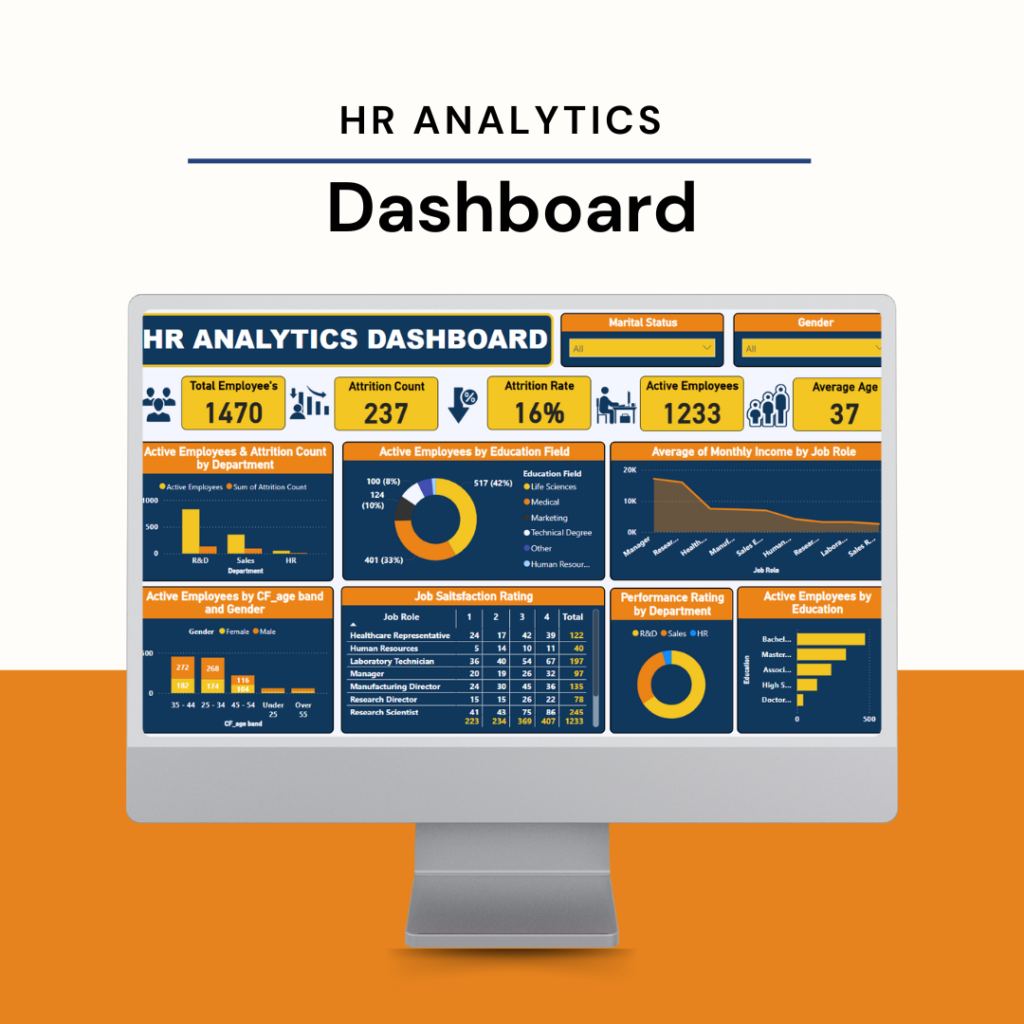
This interactive dashboard provides a comprehensive overview of key human resources metrics, enabling data-driven insights into workforce demographics, employee performance, and compensation.
Workforce Demographics:
Analyzes employee distribution by gender, providing insights into workforce diversity.
Visualizes the distribution of employees based on their distance from home.
Employee Performance:
Evaluates employee performance based on gender, identifying any potential disparities or areas for improvement.
Compensation Analysis:
Calculates and displays average income based on hourly rates, providing valuable insights into compensation structures.
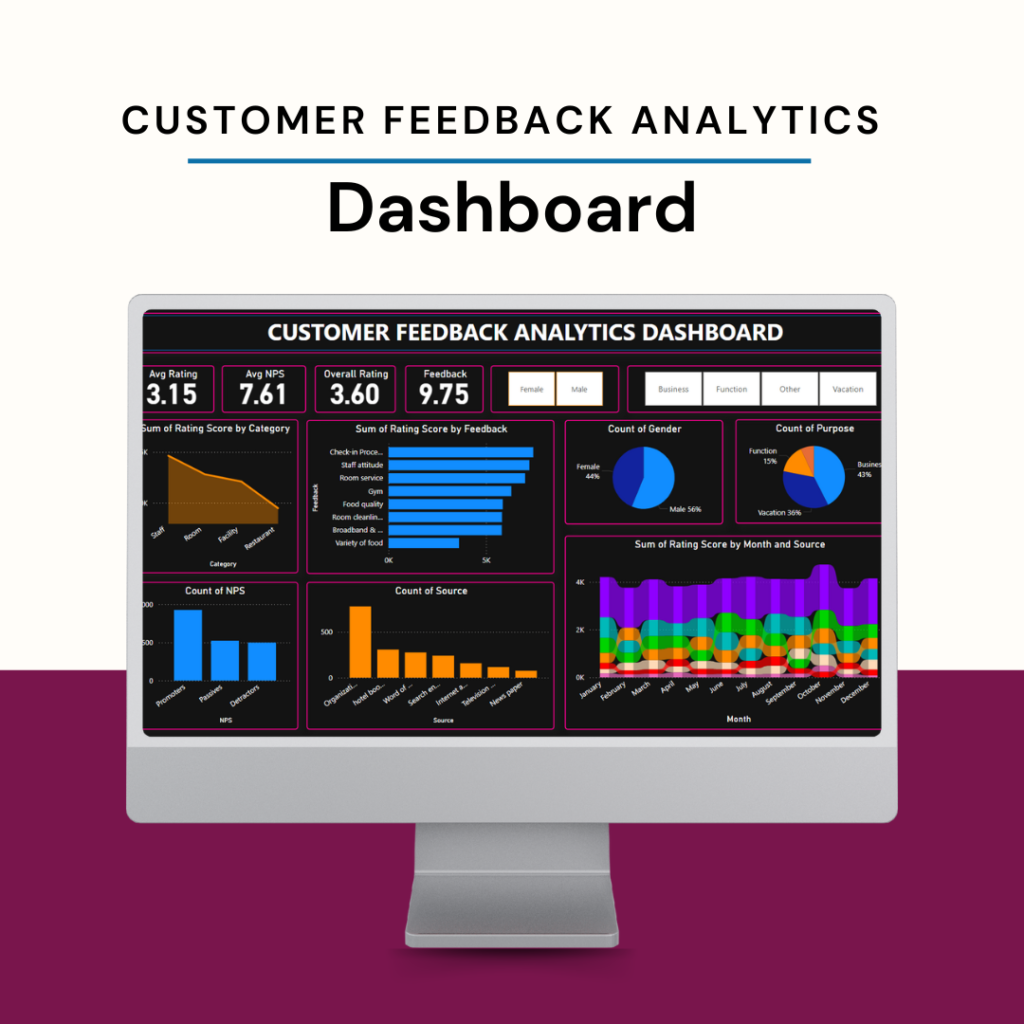
This interactive dashboard provides a comprehensive overview of Customer Analytics. It is designed to simplify complex data, helping businesses maximize profits and optimize strategies.
This dashboard provides a comprehensive analysis of customer feedback:
Customer Satisfaction:
Tracks key metrics such as average rating and Net Promoter Score (NPS) to provide a holistic view of customer satisfaction levels.
Overall Rating Analysis:
Visualizes the distribution of overall ratings, identifying areas of strength and weakness in customer experience.
Feedback Analysis:
Analyzes customer feedback text, identifying common themes, concerns, and areas for improvement.
Customer Segmentation:
Analyzes customer feedback by gender, to understand and address the specific needs and expectations of different customer segments.
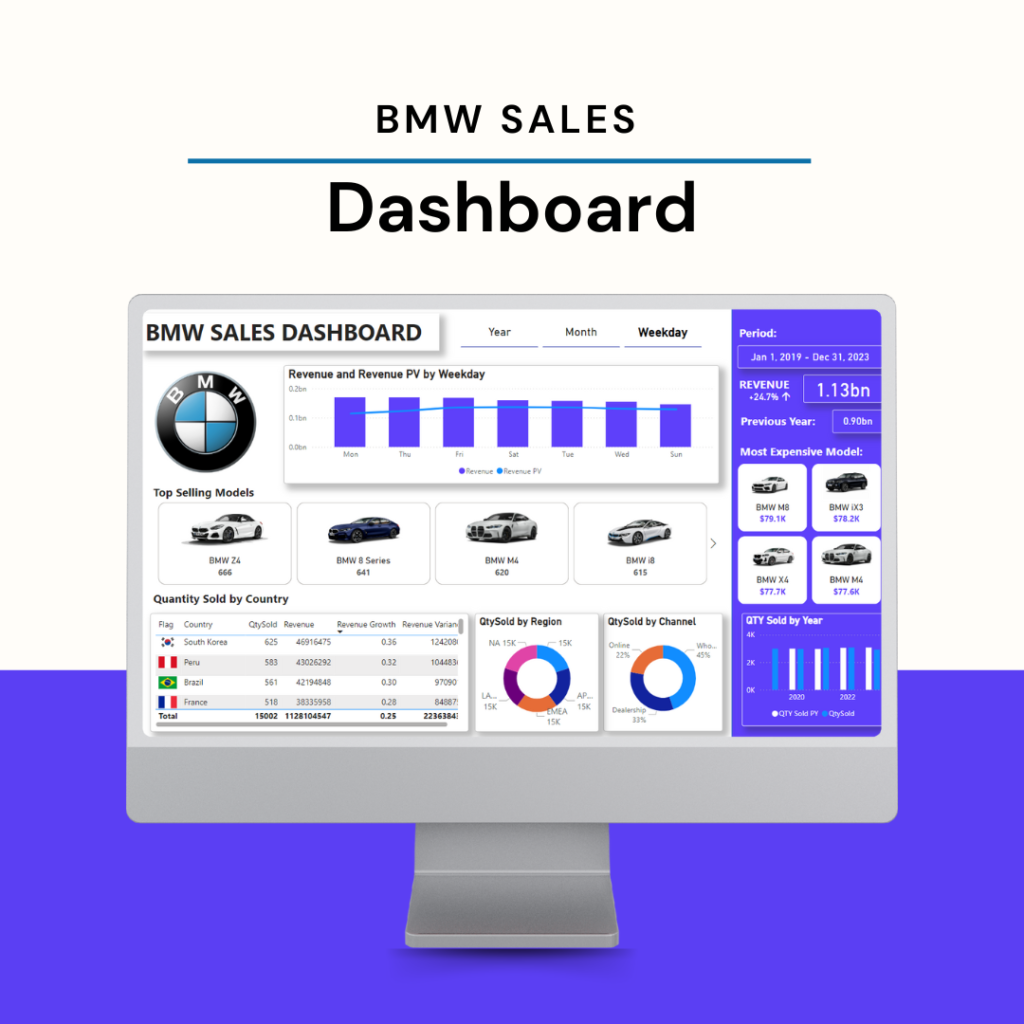
This interactive dashboard provides a comprehensive overview of BMW Sales. It is designed to simplify complex data, helping businesses maximize profits and optimize strategies.
The dashboard offers valuable insights into sales trends, top-selling models, and regional market dynamics.
Sales Performance:
Tracks sales trends over time, analyzing sales by year and month to identify seasonal patterns and year-over-year growth.
Product Performance:
Identifies top-selling BMW models, providing valuable insights into customer preferences and market demand.
Analyzes the sales performance of the most expensive BMW models, understanding their contribution to overall revenue.
Regional Analysis:
Visualizes sales quantity by country, enabling the identification of high-growth markets and areas with untapped potential.
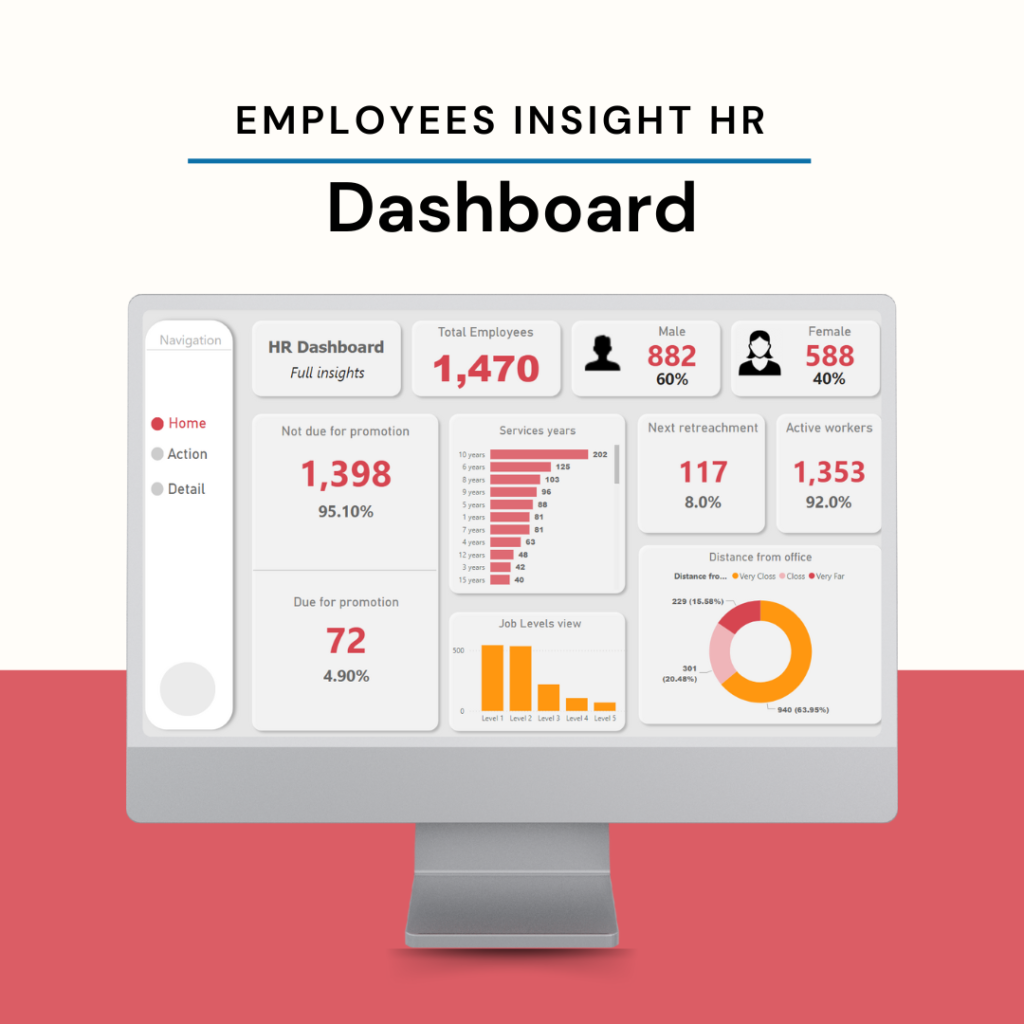
This interactive dashboard provides a comprehensive overview of HR Dashboard. It is designed to simplify complex data, helping businesses maximize profits and optimize strategies.
This comprehensive HR dashboard provides a centralized view of key employee information:
Employee Overview:
Displays the total number of employees within the organization.
Visualizes employee service years through charts or graphs.
Presents distance from home data for each employee.
Action Buttons:
Streamlines HR processes with dedicated “Action and detail” buttons .
Detailed Employee Information:
Provides access to detailed employee profiles with comprehensive information, including contact details, job history, performance records, and more.
This interactive dashboard provides a comprehensive overview of HR Dashboars. It is designed to simplify complex data, helping businesses maximize profits and optimize strategies.
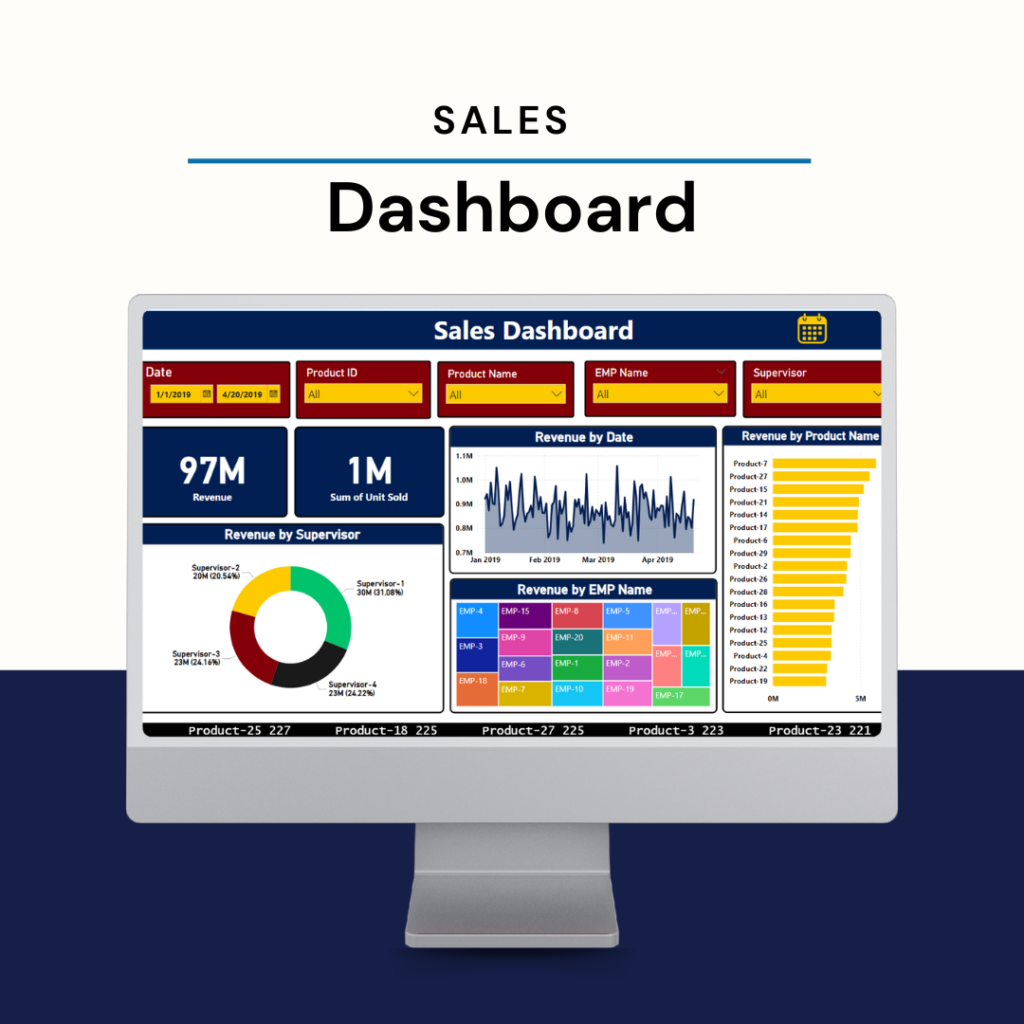
This dynamic sales dashboard provides a real-time overview of key sales performance indicators.
Product-Level Performance:
Displays detailed information on product ID, product name, employee name, and supervisor for each sale.
Tracks revenue and units sold for individual products, providing insights into product popularity and sales trends.
Supervisor-Level Analysis:
Visualizes revenue generated by each supervisor, enabling managers to identify top-performing teams and areas for improvement.
Product-Level Revenue Analysis:
Tracks revenue generated by each product name, providing insights into the most profitable products and areas for sales focus.
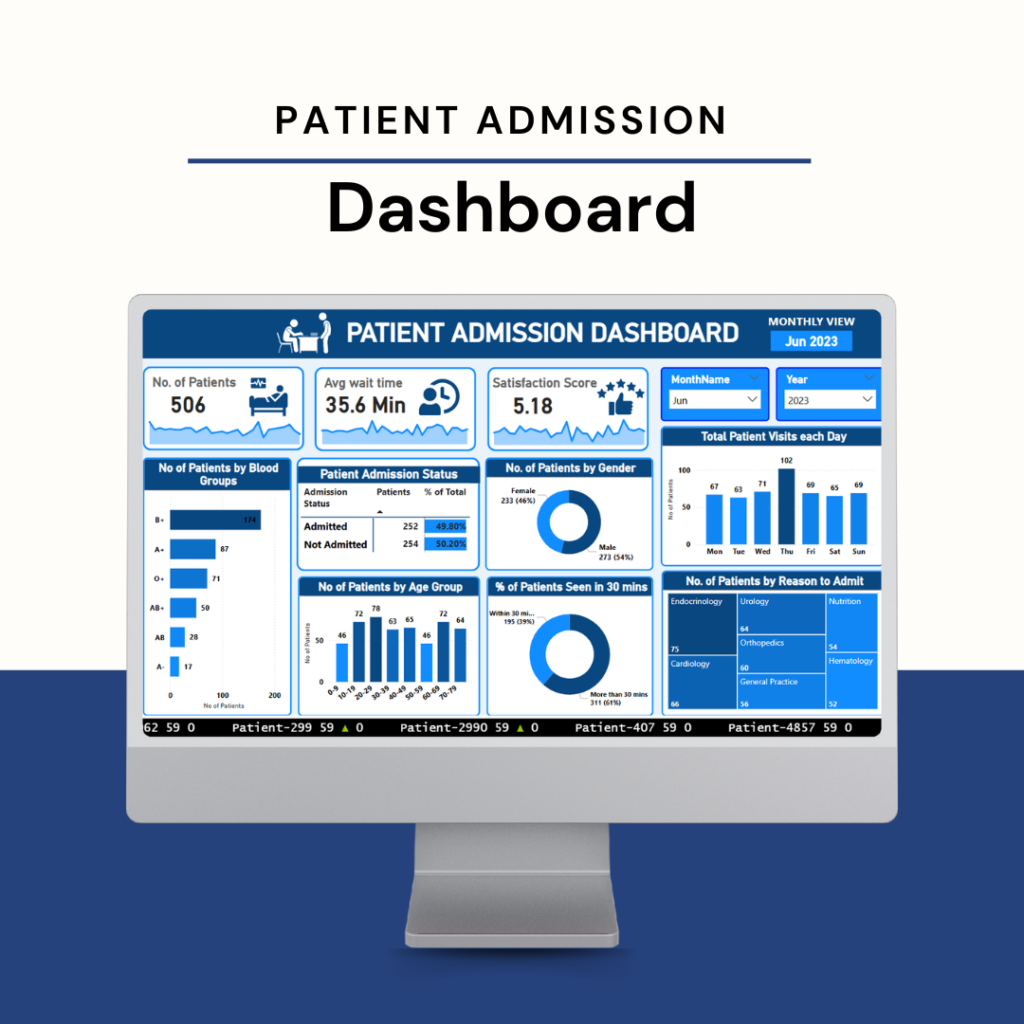
The Patient Admission Dashboard is a comprehensive tool designed to streamline and visualize critical data for healthcare facilities.
It provides real-time insights into patient admissions, including:
Admission Trends: Analyze daily, weekly, and monthly admission patterns for better resource allocation.
Patient Demographics: Gain an overview of patient age, gender, and other demographic information.
Key Metrics: Display blood groups, reason to admit, number of patients admitted. This user-friendly dashboard ensures healthcare professionals can make data-driven decisions, enhance operational efficiency, and improve patient care quality.